How Air Pollution and Income Relate to Life Expectancy in US Counties?
Manideep Pendyala, Ashwath Ramsundar
DATA WRANGLING 16:954:597:01 (MSDS, Rutgers University)
Objective
To examine how air pollution (PM2.5) and median household income relate to life expectancy across U.S. counties. The goal was to explore whether counties with higher pollution and lower income experience shorter life expectancies.
Background
Life expectancy in the U.S. varies dramatically by region due to both environmental and socioeconomic factors. This project analyzed the intersection of these influences using three major public datasets — CDC life expectancy, EPA air quality, and Census ACS income — merged through standardized FIPS codes.
Methodology
Data Sources:
Life Expectancy: CDC U.S. Small-Area Life Expectancy Estimates (2010–2015).
Air Pollution: 2022 EPA PM2.5 daily air quality data.
Income: 2022 ACS 5-Year Median Household Income.
Processing:
Aggregated life expectancy from census tract to county level.
Calculated annual mean PM2.5 levels per county.
Cleaned and aligned all datasets by 5-digit FIPS codes.
Tools: Python (pandas, numpy, matplotlib), R, and Excel for data wrangling and visualization.
Results
Negative correlation between PM2.5 and life expectancy.
Positive correlation between income and life expectancy.
Regions with both high pollution and low income—notably in the South and Midwest—showed the lowest life expectancies.
Visualizations (scatterplots, boxplots, and 3D maps) clearly revealed these patterns.
Figures
Scatterplot: Life expectancy vs. PM2.5 by county.
Boxplot: Life expectancy by PM2.5 Exposure tier.
Chloropleth Map: County-level overlay of PM2.5 and life expectancy trends.

Chloropleth Map: County-level overlay of PM2.5 and life expectancy trends.
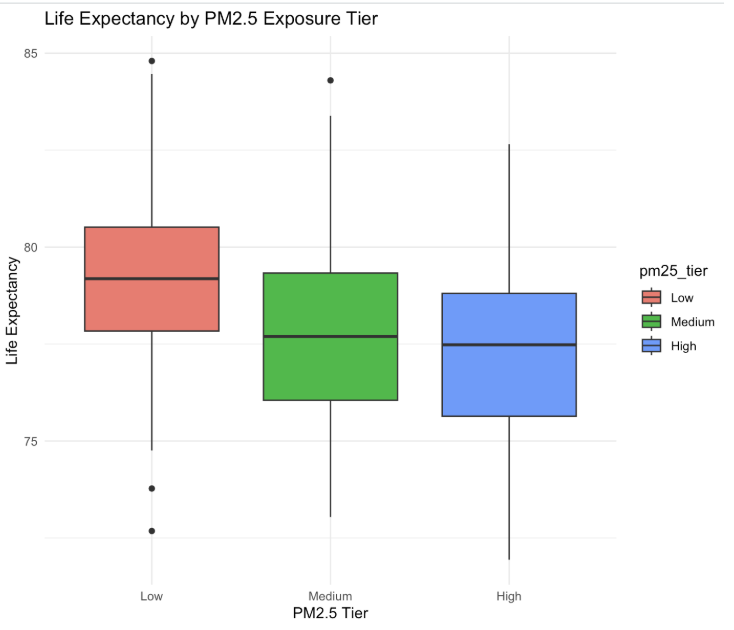
Boxplot: Life expectancy by PM2.5 Exposure tier.

Scatterplot: Life expectancy vs. PM2.5 by county.
The full project report, Air, Income, and Lifespan: A U.S. County-Level Analysis, is available as a final submission from Rutgers University, and the accompanying implementation code can be accessed on GitHub.
Report: Download Report (PDF)
Code Repository: GitHub – Air-Income-and-Lifespan-A-U.S.-County-Level-Analysis
This repository includes the full data-wrangling and analysis pipeline, featuring dataset integration via FIPS codes, PM2.5 aggregation, income correlation analysis, and visualizations exploring the relationship between air quality, income, and life expectancy across U.S. counties.